JAMB Economics Note: Economics as a Science
Table of Contents
- Definitions of Economics by Prominent Economists
- Topics and Explanations
- Explanation of the PPF Diagram
- Real-Life Applications of PPF:
- Classwork Questions
Definitions of Economics by Prominent Economists
- Lionel Robbins (1932):
Economics is “the science which studies human behavior as a relationship between ends and scarce means which have alternative uses.”- Key Idea: Focuses on scarcity, choice, and opportunity cost.
- Adam Smith (1776):
Economics is “an inquiry into the nature and causes of the wealth of nations.”- Key Idea: Concentrates on wealth creation, production, and distribution.
- Alfred Marshall (1890):
Economics is “a study of mankind in the ordinary business of life.”- Key Idea: Emphasizes human welfare and how economic activities improve well-being.
- Paul Samuelson (1948):
Economics is “the study of how people and society choose, with or without the use of money, to employ scarce productive resources that could have alternative uses, to produce various commodities over time and distribute them for consumption, now and in the future, among various persons and groups in society.”- Key Idea: Focuses on resource allocation, production, and distribution over time.
- John Stuart Mill (1848):
Economics is “the practical science of the production and distribution of wealth.”- Key Idea: Highlights the practical aspects of producing and distributing resources.
Topics and Explanations
A. Basic Concepts in Economics
- Wants: Unlimited human desires for goods and services that provide satisfaction.
- Examples: Food, clothing, smartphones.
- Key Insight: Human wants are insatiable, driving economic activity.
- Scarcity: The limited nature of resources compared to unlimited wants.
- Examples: Limited arable land for farming or fossil fuels.
- Key Insight: Scarcity necessitates choice and prioritization.
- Choice: The decision to allocate scarce resources to satisfy competing wants.
- Examples: A government choosing between building schools or hospitals.
- Key Insight: Every choice comes with a trade-off, represented by opportunity cost.
- Scale of Preference: A prioritized list of wants arranged by importance.
- Examples: Paying school fees before buying a luxury watch.
- Key Insight: Helps individuals and governments decide on the most urgent needs.
- Opportunity Cost: The value of the next best alternative foregone when a decision is made.
- Examples: A country investing in healthcare at the expense of infrastructure.
- Key Insight: Reflects the cost of scarcity and decision-making.
- Rationality: Making decisions that maximize satisfaction (utility).
- Examples: A farmer choosing the crop with the highest profit potential.
- Key Insight: Rationality ensures optimal use of scarce resources.
- Production: The process of combining resources to create goods and services.
- Examples: Manufacturing cars, growing crops.
- Key Insight: Production determines the availability of goods in the economy.
- Distribution: The allocation of produced goods and services among individuals or groups.
- Examples: Income distribution between the rich and poor.
- Key Insight: Determines who benefits from economic activities.
- Consumption: The use of goods and services to satisfy wants.
- Examples: Eating food, using electricity.
- Key Insight: Completes the economic cycle by fulfilling human desires.
B(i). Economic Problems
- What to Produce?
Economies must decide which goods and services to produce based on available resources and societal needs.- Example: A country choosing between producing consumer goods or capital goods.
- How to Produce?
This concerns the methods and techniques of production—whether to use labor-intensive or capital-intensive methods.- Example: A company deciding between using robots or manual labor.
- For Whom to Produce?
This determines how goods and services are distributed among the population.- Example: A government deciding whether to allocate resources equally or prioritize the poor.
- Efficiency of Resource Use:
Ensures that resources are utilized in the most productive way to avoid waste.- Example: Using renewable energy to reduce resource depletion.
B(ii). Application of the Production Possibility Frontier (PPF)
The Production Possibility Frontier (PPF) illustrates the concepts of scarcity, choice, and opportunity cost.
- Key Features:
- Scarcity: Points outside the curve are unattainable.
- Choice: Points on the curve represent production possibilities.
- Opportunity Cost: Movement along the curve reflects trade-offs.
- Efficiency: Points on the curve are efficient; points inside are inefficient.
- Economic Problem Solving Using PPF:
- Helps decide optimal production combinations.
- Highlights resource underutilization or scarcity.
- Reflects trade-offs and opportunity costs.

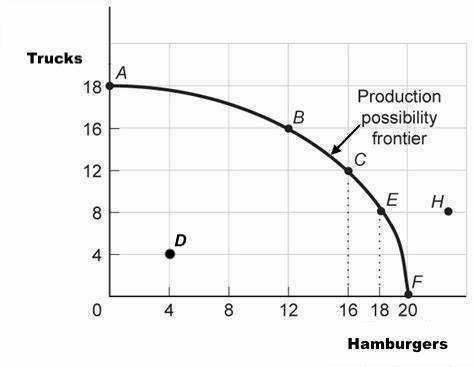
Explanation of the PPF Diagram
- Axes of the Graph:
- The horizontal axis represents the production of Hamburgers.
- The vertical axis represents the production of Trucks.
- Both are examples of goods that require resources for production.
- The PPF Curve:
- The curve represents all possible combinations of hamburgers and trucks that can be produced using the available resources efficiently.
- The PPF is concave because resources are not equally suited for producing both goods, meaning that as more of one good is produced, increasingly more of the other good must be sacrificed.
- Key Points on the PPF:
- Point A: All resources are used to produce 18 trucks and 0 hamburgers. This is an extreme point where resources are completely allocated to one good.
- Point F: All resources are used to produce 20 hamburgers and 0 trucks.
- Point B, C, and E: These are points on the curve. They represent efficient production, meaning the economy is using all available resources without waste.
- Point D: This point is inside the PPF and represents inefficient production. Some resources are underutilized, meaning the economy could produce more trucks, hamburgers, or both.
- Point H: This point is outside the PPF and represents a production combination that is currently unattainable given the available resources and technology.
- Economic Concepts Illustrated by the PPF:
- Scarcity: The curve limits production to combinations within the boundary, as resources are finite.
- Opportunity Cost: Moving from one point to another on the curve demonstrates the trade-off. For example, moving from Point A to Point B requires sacrificing trucks to produce more hamburgers.
- Efficiency: Points on the curve (e.g., B, C, E) represent efficient use of resources. Producing at these points means the economy is maximizing its potential.
- Inefficiency: Points inside the curve (e.g., D) indicate underutilized resources, such as unemployment or inefficiency in production processes.
- Economic Growth: Shifting the curve outward (e.g., making Point H attainable) represents growth, typically achieved by improving technology or increasing resource availability.
Real-Life Applications of PPF:
- A country deciding how to allocate resources between military goods (trucks) and consumer goods (hamburgers).
- Companies deciding between producing capital goods or consumer products.
Classwork Questions
Instruction: Choose the correct option for each question.
- Which of the following definitions best reflects Lionel Robbins’ view of economics?
A. Economics as the study of wealth creation
B. Economics as the science of scarcity and choice
C. Economics as the production of goods and services
D. Economics as the allocation of resources over time - What is the basic reason for scarcity in economics?
A. Unlimited resources
B. Limited wants
C. Mismanagement of resources
D. Limited resources relative to unlimited wants - A student spends ₦500 to buy a book instead of a concert ticket. The concert ticket represents:
A. Real cost
B. Opportunity cost
C. Scale of preference
D. Rational choice - The decision on “How to Produce” primarily depends on:
A. The income of the producer
B. Available resources and technology
C. Consumer preferences
D. The location of production - The concept of PPF helps to explain:
A. Wealth creation
B. Economic scarcity and opportunity cost
C. Overproduction in the economy
D. Price determination


